After spending the past month travelling – Dubai and Italy (more on that in a future post), and with the markets having to contend with the US Government shutdown and the looming US debt default crisis (luckily this ended up being averted at the very last minute), I took a break from trading. However, now back home in Cairo and newly refreshed after living “la doce vita” on the Amalfi Coast for the past week ![]() , I share with you my trading analysis for the week ahead…
, I share with you my trading analysis for the week ahead…
 EURUSD
Chart – Weekly & Daily
Short @ 1.3715
Target @ 1.3559
Stop Loss @ 1.3720
Risk:Reward = 1:3
Long @ 1.3400
Target @ 1.3559
Stop Loss @ 1.3325
Risk:Reward = 1:2
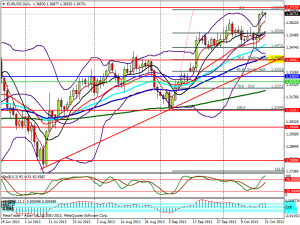
As the price heads towards the recent high of 1.3715 on the weekly chart, I am looking for reasons to go short. This is as important level on the weekly chart and I am certainly expecting a reaction at this point. The daily chart from last Friday resulted in a doji candle near this level, so I have used this as extra confirmation that price is struggling to get through 1.3715 and there could potentially be a bounce back down from this area.
 I entered the trade this morning with my stop just above at 1.3720. My target is at the 23.6% fib area, which is where I expect price to first react. There is an excellent 1:3 risk to reward ratio with this trade, so another good reason to take the trade.
Of course assuming there is a bounce back down, the area which I will definitely be looking to enter the trade long is at the yellow highlighted area – this area at 1.3400 is also 50% fib, support, whole number, 55 ema, trendline and bollinger ie. MULTIPLE REASONS. Of course price may not quite get that far south and may resume it’s bull run at the 38.2% fib area (1.3472), so watch smaller time frames for reactions here.
 USDCHF
Chart – weekly
Long @ 0.9000
Target 1 @ 0.9260
Target 2 @ 0.9400
Stop Loss @ 0.8925
Risk:Reward 1 = 1:3
Risk:Reward 2 = 1:5
Price has continued to hold at 0.9000 since April last year. I expect it to hold again at this level, so will be looking for reasons to enter long ie. I will be looking for candle formations and extra reasons on smaller time frames. The overall potential risk:reward on this trade is a very impressive 1:5, so a good enough reason to take the trade also.
 USDJPY
POTENTIAL 980 PIP MOVE BREWING…
Chart – Weekly
Triangle Break
I will be looking over the coming weeks for a potential triangle break which has the potential to result in a move of 980 pips. Of course, this could break either above or below, however, my bias is for it to break above. Keep this one on your radar over the next little while.
WARNING:
The craziest day in the Forex news calendar – aka non-farm payroll – is happening tomorrow. Usually this news comes out on the first Friday of every month. However, due to the US shutdown, the release of this all important jobs number has been delayed until tomorrow. This news announcement can cause wild swings in the market, so the safest bet is to wait until after the news announcement before entering trades. Keep an eye on www.forexfactory.com for up to the minute news announcements.
Take care out in the news mine field this week.
Happy trading
Jackie
